Creating a multi-stock TradingView dashboard allows you to monitor multiple assets simultaneously and make data-driven trading decisions. In this guide, we will walk through setting up an advanced dashboard with multiple charts, Pine Script overlays, and custom indicators that track your portfolio in real-time.
Why a Multi-Stock Dashboard?
A well-designed dashboard helps you:
- Monitor correlated assets (AAPL, MSFT, NVDA tech correlation)
- Track sector rotation across your portfolio
- Identify divergences between major indices and stocks
- Execute faster with pre-configured watchlists
Setting Up Your Multi-Chart Layout
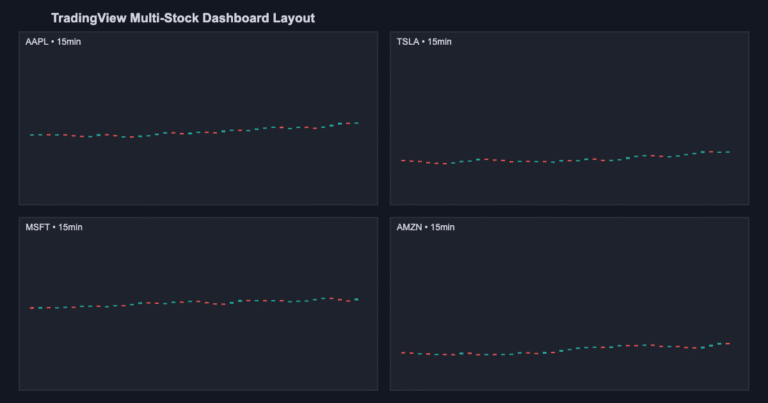
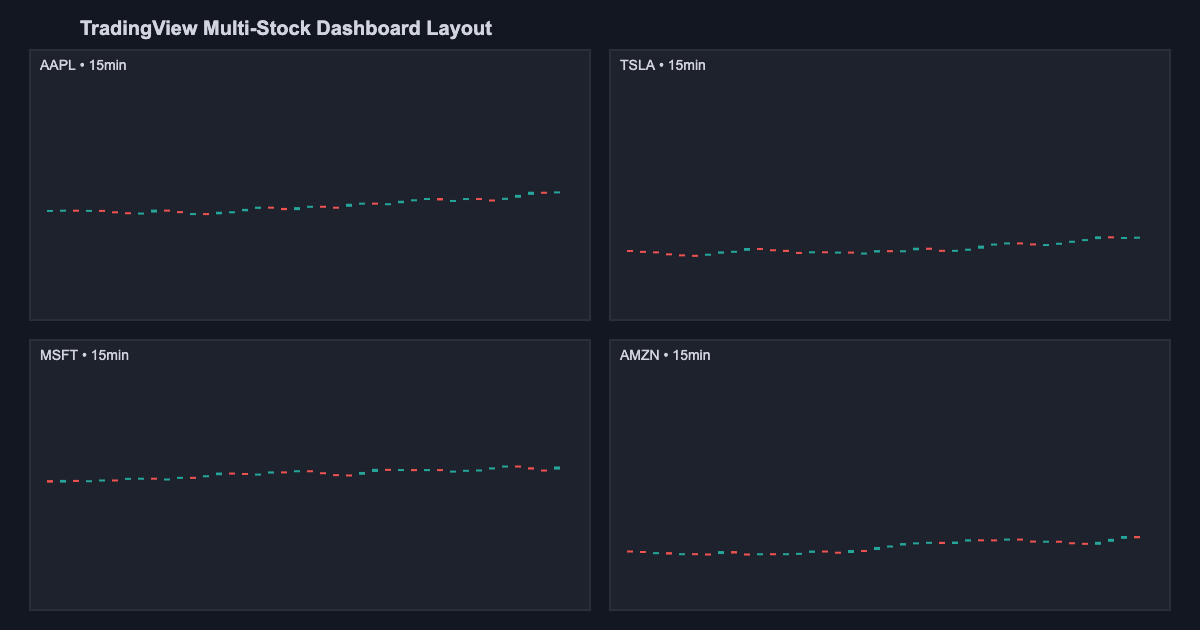
TradingView Premium allows up to 8 charts on one layout. Start with a 2×2 grid:
- Top-left: AAPL 1-hour chart
- Top-right: TSLA 1-hour chart
- Bottom-left: MSFT 15-minute chart
- Bottom-right: AMZN 15-minute chart
This layout gives you a comprehensive view across large-cap tech stocks. You can synchronize timeframes or keep them independent based on your strategy.
Pine Script Table Overlays for Multi-Ticker Data
One of the most powerful features is using Pine Script v5 to create dynamic tables showing real-time data across multiple symbols:
indicator(Multi-Stock Dashboard, overlay=true)
table.new_cell = table.cell(table_id, column, row, text)
var tbl = table.new(position.top_left, 4, 5, border_color=color.gray, bgcolor=color.black)
var symbols = array.from(AAPL, TSLA, MSFT, AMZN)
for i = 0 to 3
    sym = array.get(symbols, i)
    curr_price = request.security(sym, 1, close)
    pct_change = (curr_price - request.security(sym, D, open[1])) / request.security(sym, D, open[1]) * 100
    table.cell(tbl, i, 1, text=sym)
    table.cell(tbl, i, 2, text=str.tostring(curr_price, #.##))
Using request.security() for Cross-Symbol Data
The request.security() function allows your Pine Script indicator to pull data from different symbols without switching charts:
aapl_rsi = ta.rsi(request.security(AAPL, 60, close), 14)
tsla_rsi = ta.rsi(request.security(TSLA, 60, close), 14)
msft_rsi = ta.rsi(request.security(MSFT, 60, close), 14)
This lets you build correlation tables, heatmaps, and composite indicators that track portfolio momentum across multiple positions.
Building a Heatmap-Style Dashboard
Color-coded heatmaps make it easy to spot which assets are overbought or oversold:
- Green = Above 20-day moving average
- Yellow = Between 20 and 50-day MA
- Red = Below 50-day moving average
Use Pine Script to auto-color the background of each symbol cell based on its relative strength:
bgcolor(rsi > 70 ? color.new(color.red, 80) : rsi < 30 ? color.new(color.green, 80) : na)Creating Color-Coded Signal Overlays
Add buy/sell signals for each watchlist stock on the same chart using different marker colors:
- Blue triangle = AAPL buy signal
- Purple triangle = TSLA buy signal
- Green triangle = MSFT buy signal
- Orange triangle = AMZN buy signal
Pine Script Indicator Tables for Portfolio Monitoring
Build dynamic tables that update in real-time showing:
- Current price for each symbol
- % Change from open
- Distance from 20-day MA
- RSI reading
- MACD signal status
This eliminates the need to jump between 4 charts manually.
TradingView Layout Saving & Syncing
Save your dashboard layout so it loads automatically:
- Click Chart Settings (gear icon)
- Select Save Layout
- Name it Tech Stock Dashboard
- All users on your account see the same layout
Advanced: Dashboard Automation
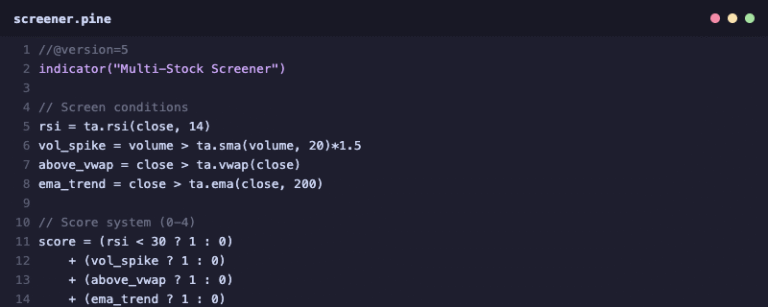
If you use Pine Script stock screeners, you can dynamically populate your dashboard based on market conditions.
Frequently Asked Questions
Q: Can I monitor more than 8 charts? Yes, use multiple saved layouts and switch between them, or use Pine Script table overlays to condense data into 2-3 charts.
Q: Does request.security() repaint? Not if used correctly on the same timeframe as your chart. Repaint risk increases on lower timeframes.
Q: Whats the best layout for day traders? Try 1-minute and 5-minute charts for intraday traders, or check our guide on best TradingView indicators for intraday trading.
Need a custom TradingView dashboard for your trading strategy?
Contact us at jayadevrana.com for premium consulting and custom indicator development.