Supertrend is a trend-following indicator that has earned cult status among algo traders for one simple reason: it catches big moves and exits before they reverse. Unlike lagging moving average crossovers, Supertrend is responsive to volatility through ATR (Average True Range), making it particularly effective in India’s volatile market environment.
This guide covers exactly how Supertrend works mathematically, how to code it from scratch in Pine Script v5, and the specific settings that work best for NSE stocks. Need a custom Pine Script solution? Jayadev Rana builds professional indicators and strategies for traders.
How Supertrend Works: The Mathematics
Supertrend is fundamentally a volatility-adjusted support and resistance indicator. It creates dynamic bands around price using ATR, which measures how much an asset moves on average:
Upper Band = (HIGH + LOW) / 2 + Multiplier x ATR
Lower Band = (HIGH + LOW) / 2 – Multiplier x ATR
The key insight: Supertrend bands expand during volatile periods and contract during calm trading. This means the indicator naturally tightens stops during consolidation (when risk is lower) and widens them during breakouts (when bigger moves happen).
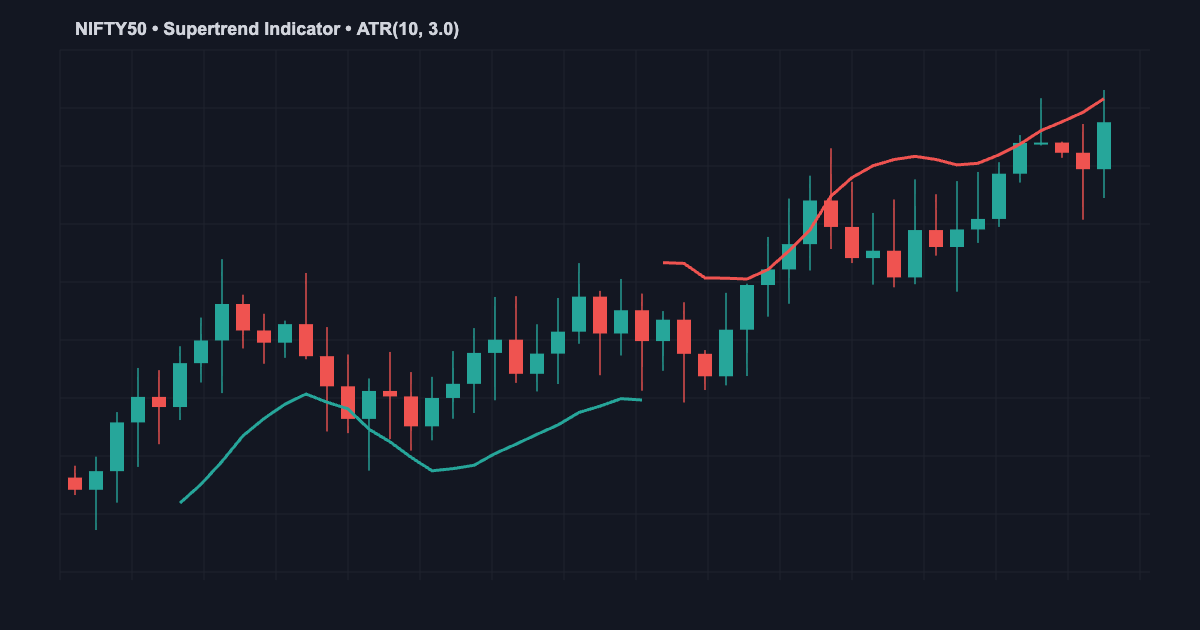
Most traders use ATR period 10 and multiplier 3.0 as the default. When price closes on the opposite side of the band, the indicator flips—that’s your signal.
Coding Supertrend in Pine Script v5
//@version=5
indicator("Supertrend Custom", overlay=true)

// Input parameters
atr_period = input(10, title="ATR Period")
multiplier = input(3.0, title="Multiplier")

// Calculate ATR
atr = ta.atr(atr_period)

// Calculate basic bands
hl2_val = (high + low) / 2
basic_upper = hl2_val + multiplier * atr
basic_lower = hl2_val - multiplier * atr

// Final bands with smoothing
var float final_upper = na
var float final_lower = na

final_upper := na(final_upper[1]) ? basic_upper : (basic_upper < final_upper[1] or close[1] > final_upper[1] ? basic_upper : final_upper[1])
final_lower := na(final_lower[1]) ? basic_lower : (basic_lower > final_lower[1] or close[1] < final_lower[1] ? basic_lower : final_lower[1])

// Determine trend direction
var int direction = 1
direction := direction[1] == 1 and close <= final_lower ? -1 : direction[1] == -1 and close >= final_upper ? 1 : direction[1]

// Plot with colors
st_line = direction == 1 ? final_lower : final_upper
plot(st_line, "Supertrend", color=direction == 1 ? color.green : color.red, linewidth=3)

// Signal detection
buySignal = direction == 1 and direction[1] == -1
sellSignal = direction == -1 and direction[1] == 1

plotshape(buySignal, title="Buy", style=shape.triangleup, location=location.belowbar, color=color.green, size=size.small)
plotshape(sellSignal, title="Sell", style=shape.triangledown, location=location.abovebar, color=color.red, size=size.small)

alertcondition(buySignal, title="ST Buy", message="Supertrend Buy on {{ticker}}")
alertcondition(sellSignal, title="ST Sell", message="Supertrend Sell on {{ticker}}")
This code creates a true Supertrend with band smoothing. The key mechanism: once the upper band is broken to the downside, it flips to lower band tracking, preventing false reversals in choppy markets.
Buy and Sell Signal Rules
Green Supertrend: Price is above the lower band. Uptrend is intact. Buy signal triggers when the band flips from red to green.
Red Supertrend: Price is below the upper band. Downtrend is intact. Sell signal triggers when the band flips from green to red.
High-Probability Entry Filters
Enter only when Supertrend has been green for at least 2-3 bars. Wait for pullback entries to the band for best risk-reward. Confirm with volume exceeding the 20-period average at the moment of trend flip. Start trading after 9:45 AM IST—the first 15 minutes are noisy.
Exit Rules
Close position when Supertrend flips color (primary stop loss). Take 50% off when price moves 1.5x ATR in your favor, trail the rest with Supertrend. For intraday, exit all positions by 3:00 PM IST regardless of signal.
If building this yourself feels overwhelming, you can connect with a Pine Script expert on WhatsApp for a custom solution.
Optimal Settings for Different Timeframes
Intraday (1-5 min charts): ATR Period 7-10, Multiplier 2.0-2.5. Tight bands catch quick reversals. Best for TCS, Infosys, HDFC Bank on 5-minute charts.
Short-term swings (15-30 min): ATR Period 10, Multiplier 3.0 (standard). Default settings work well here. Bands are responsive but not too tight.
Daily charts (swing trading): ATR Period 14, Multiplier 3.5-4.0. Wider bands prevent whipsaws from intraday volatility. Best for Nifty 50 daily chart multi-day swings.
Weekly charts (position trading): ATR Period 14-21, Multiplier 4.0-5.0. Only the strongest trends trigger signals. Perfect for identifying multi-month trends.
Combining Supertrend with Other Indicators
Supertrend + RSI: RSI divergence at Supertrend reversals is extremely powerful. Enter short when Supertrend flips red while RSI shows bearish divergence. See our RSI divergence guide for the code.
Supertrend + Volume: A Supertrend flip on above-average volume has 70%+ win rate. A flip on below-average volume is often a false signal.
Supertrend + EMA 200: Only trade buy signals when price is above the 200 EMA for trend alignment. This filters out counter-trend trades. Check our VWAP strategy guide and best intraday indicators for more combinations.
Real-World Example: Trading TCS on Supertrend
TCS on a 15-minute chart with Supertrend (10, 3.0): At 10:30 AM IST, TCS breaks above its Supertrend lower band with a volume spike. Signal flips green. You enter at ₹3,650 with the lower band as your stop at ₹3,620. Price runs to ₹3,710 by 1:00 PM. You take 50% profit (₹60/share). The remaining position trails with Supertrend. When price closes below the band at 2:45 PM, you exit at ₹3,695. Net result: +₹70 average per share—a 1.9% intraday gain on a liquid stock.
FAQ: Supertrend Indicator Questions
Q: Why does Supertrend give so many false signals on choppy days?
A: On low-volatility days, ATR contracts and bands get tight. Price whipsaws through bands repeatedly. Solution: use higher multiplier (3.5) or add volume filter.
Q: What are the best Supertrend settings for Nifty 50?
A: Daily chart: ATR 14, Multiplier 3.5. 15-minute chart: ATR 10, Multiplier 2.5. These have been optimized for Nifty’s volatility profile.
Q: Should I exit on Supertrend flip or wait for confirmation?
A: Exit on flip immediately—that’s your stop loss. Waiting costs more often than it saves. The flip IS the signal.
Q: Is Supertrend better than moving average crossovers?
A: Supertrend is faster and more responsive to volatility changes. MA crossovers lag more but are smoother. For algo trading, Supertrend is generally superior.
Need a Custom Pine Script Solution?
Jayadev Rana is a professional Pine Script developer who builds custom indicators, strategies, and automated trading systems for TradingView.