RSI divergence is one of the most powerful reversal signals in technical analysis. When price makes a new high but RSI fails to confirm it, something is wrong beneath the surface—momentum is fading, and a reversal is often imminent. Spotting these divergences manually is tedious, but automating them in Pine Script means you never miss a setup.
In this guide, I’ll show you how to detect both bullish and bearish RSI divergence programmatically, build a complete Pine Script indicator with visual divergence lines, and implement a strategy that trades these signals profitably. Need a custom Pine Script solution? Jayadev Rana builds professional indicators and strategies for traders.
What Is RSI Divergence?
Divergence occurs when price and an oscillator (like RSI) move in opposite directions. There are two types:
Bullish divergence: Price makes a lower low, but RSI makes a higher low. This signals that selling pressure is weakening despite the lower price, suggesting an upward reversal is coming.
Bearish divergence: Price makes a higher high, but RSI makes a lower high. This means buying pressure is fading despite the new high—a potential downward reversal.
Divergence doesn’t mean “reverse immediately.” It’s a warning that the current trend is losing steam. The best trades come when divergence aligns with support/resistance levels and volume confirmation.
Detecting Pivots in Pine Script
To detect divergence automatically, we first need to identify swing highs and swing lows (pivots) in both price and RSI. Pine Script’s ta.pivothigh() and ta.pivotlow() functions handle this:
//@version=5
indicator("RSI Divergence Detector", overlay=false)
// Inputs
rsiLength = input(14, "RSI Length")
pivotBars = input(5, "Pivot Lookback")
// Calculate RSI
rsiVal = ta.rsi(close, rsiLength)
// Find pivots in RSI
rsiPivotHigh = ta.pivothigh(rsiVal, pivotBars, pivotBars)
rsiPivotLow = ta.pivotlow(rsiVal, pivotBars, pivotBars)
// Find pivots in price
pricePivotHigh = ta.pivothigh(high, pivotBars, pivotBars)
pricePivotLow = ta.pivotlow(low, pivotBars, pivotBars)
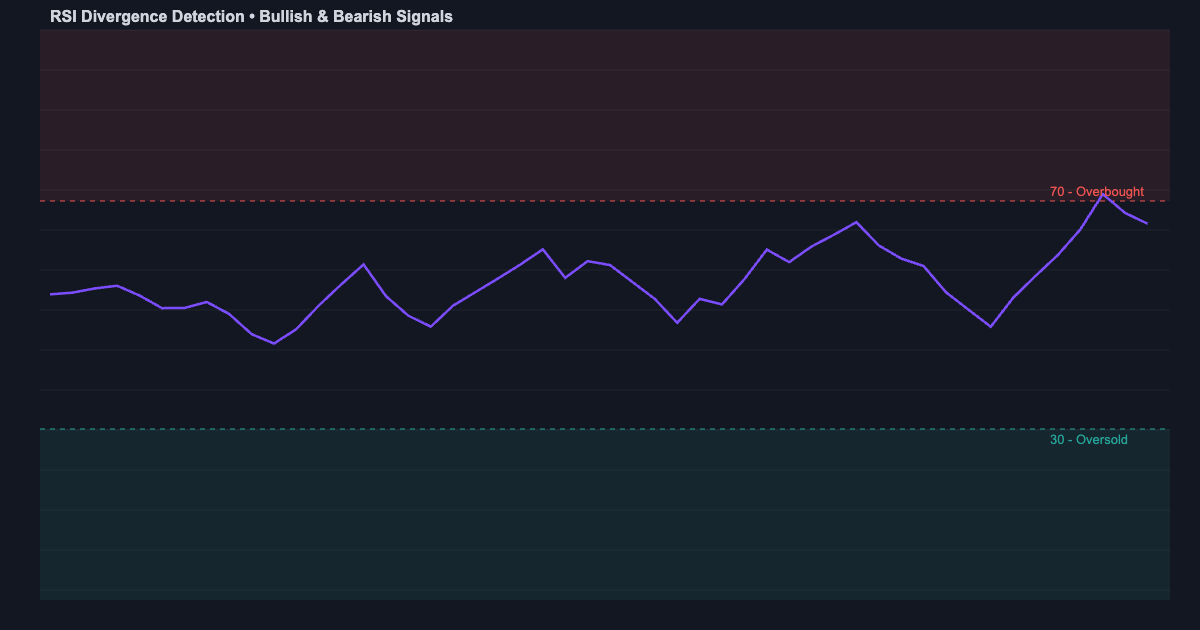
plot(rsiVal, "RSI", color=color.purple, linewidth=2)
hline(70, "Overbought", color=color.red)
hline(30, "Oversold", color=color.green)The pivotBars parameter controls how many bars on each side must be lower (for a high) or higher (for a low) to qualify as a pivot. Five bars is a good default for most timeframes.
Building the Complete RSI Divergence Indicator
Now let’s build the full divergence detection logic that compares consecutive pivots:
//@version=5
indicator("RSI Divergence Pro", overlay=false)

rsiLength = input(14, "RSI Length")
pivotBars = input(5, "Pivot Bars")

rsiVal = ta.rsi(close, rsiLength)
plot(rsiVal, "RSI", color=color.purple, linewidth=2)
hline(70, color=color.red, linestyle=hline.style_dashed)
hline(30, color=color.green, linestyle=hline.style_dashed)

// Track previous pivot values
var float prevRsiLow = na
var float prevPriceLow = na
var float prevRsiHigh = na
var float prevPriceHigh = na

rsiPH = ta.pivothigh(rsiVal, pivotBars, pivotBars)
rsiPL = ta.pivotlow(rsiVal, pivotBars, pivotBars)

// Bullish divergence: price lower low + RSI higher low
bullDiv = false
if not na(rsiPL)
    if not na(prevRsiLow) and not na(prevPriceLow)
        if low[pivotBars] < prevPriceLow and rsiPL > prevRsiLow
            bullDiv := true
    prevRsiLow := rsiPL
    prevPriceLow := low[pivotBars]

// Bearish divergence: price higher high + RSI lower high
bearDiv = false
if not na(rsiPH)
    if not na(prevRsiHigh) and not na(prevPriceHigh)
        if high[pivotBars] > prevPriceHigh and rsiPH < prevRsiHigh
            bearDiv := true
    prevRsiHigh := rsiPH
    prevPriceHigh := high[pivotBars]

// Visual signals
bgcolor(bullDiv ? color.new(color.green, 80) : na)
bgcolor(bearDiv ? color.new(color.red, 80) : na)

alertcondition(bullDiv, "Bullish Divergence", "RSI Bullish Divergence on {{ticker}}")
alertcondition(bearDiv, "Bearish Divergence", "RSI Bearish Divergence on {{ticker}}")
This indicator tracks consecutive RSI pivots and compares them with price pivots. When the comparison shows divergence, it highlights the background green (bullish) or red (bearish) and fires alerts.
Trading Strategy with RSI Divergence
The indicator alone shows where divergence exists. To trade it profitably, you need entry rules, stop-losses, and targets:
Entry rules: Enter long when bullish divergence is detected AND RSI is below 35 (oversold zone gives higher probability). Enter short when bearish divergence appears AND RSI is above 65. Wait for a confirmation candle—don't enter on the pivot bar itself.
Stop-loss: Place stops below the recent swing low (for longs) or above the recent swing high (for shorts). Use ATR-based stops if you prefer dynamic placement.
Take-profit: Target a 2:1 risk-reward ratio minimum. For stronger divergences (those at extreme RSI levels), extend to 3:1.
If building this yourself feels overwhelming, you can connect with a Pine Script expert on WhatsApp for a custom solution.
Avoiding False Divergence Signals
Not all divergences lead to reversals. Here's how to filter the weak ones:
Trend alignment: Divergence works best as a counter-trend signal in ranging markets. In strong trends, divergence often fails. Use a moving average filter to confirm you're not fighting a powerful trend.
RSI extremes matter: Divergence at RSI 60 is meaningless. Divergence at RSI 85 or 15 is powerful. Only trade divergences where RSI is in overbought (above 70) or oversold (below 30) territory.
Volume confirmation: Strong divergences show declining volume on the second leg. If volume increases on the divergent move, the trend might still have strength.
Timeframe selection: Divergence on 1-minute charts is mostly noise. Daily and 4-hour charts produce the most reliable signals. For Indian intraday trading, 15-minute is the minimum recommended timeframe. Learn more about using non-repainting indicators to ensure signal reliability.
FAQ: RSI Divergence Questions
Q: What RSI length works best for divergence detection?
A: The standard 14-period RSI works well for most timeframes. For intraday on 5-minute charts, try 9-period for faster signals.
Q: Is bullish or bearish divergence more reliable?
A: Bullish divergence at oversold levels (RSI below 30) tends to be more reliable than bearish divergence, especially in trending markets.
Q: Can RSI divergence be automated for alerts?
A: Yes, using Pine Script's alertcondition() function combined with pivot detection. Check our custom alerts guide for more.
Q: How often does RSI divergence appear?
A: On daily charts, expect 2-4 valid divergences per month per instrument. On 15-minute charts, 1-3 per day on volatile stocks. Quality over quantity always wins.
Q: Can I combine RSI divergence with other indicators?
A: Absolutely. MACD divergence confirming RSI divergence is a very strong signal. Also, divergence at key support/resistance levels has higher success rates. See our backtesting guide to test these combinations.
Need a Custom Pine Script Solution?
Jayadev Rana is a professional Pine Script developer who builds custom indicators, strategies, and automated trading systems for TradingView.