If you’ve been trading for more than a few weeks, you’ve probably experienced a perfect signal that disappears when the candle closes. This is repainting, and it’s the silent killer of trading strategies. Understanding non-repainting indicators on TradingView is fundamental to building strategies you can actually trust.
What is Repainting and Why It Destroys Strategies
Repainting occurs when an indicator recalculates and changes its values or signals after the candle has already closed. The signal appears during the candle, you note it, maybe even take a screenshot. Then the candle closes, and the signal vanishes.
This happens because the indicator uses current bar data (like the close price before the bar actually closes) or references future data that hasn’t happened yet.
Why Repainting Indicators Are Dangerous
Backtesting Illusion: Your strategy backtests at 95% win rate. You go live and immediately lose money because historical signals looked perfect but real-time signals repaint.
False Entry Signals: A repainting indicator shows a buy signal, you enter, the candle closes, the signal disappears, and price reverses against you.
Wasted Time: You optimize parameters for weeks, get incredible backtest results, then realize none of it matters in real-time.
How to Identify Repainting (4 Easy Tests)
Test 1: Visual Inspection
Watch the indicator on a live chart for 5 minutes. If signals appear, move around, and disappear as the candle develops—it’s repainting.
Test 2: Closed Bar Comparison
Screenshot your indicator on an open candle. Wait for it to close. Compare—if the signal changed, it repaints.
Test 3: Live vs Backtest Win Rate
If your live win rate is 20-30% lower than your backtest, repainting is the likely culprit.
Test 4: Code Inspection
Look for red flags: using close instead of close[1] in conditions, using current bar high/low without barstate.isconfirmed checks.
Types of Reliable Non-Repainting Indicators
Price Action Indicators: Pivot points from yesterday’s OHLC, previous bar highs/lows, and Fibonacci levels from historical swings.
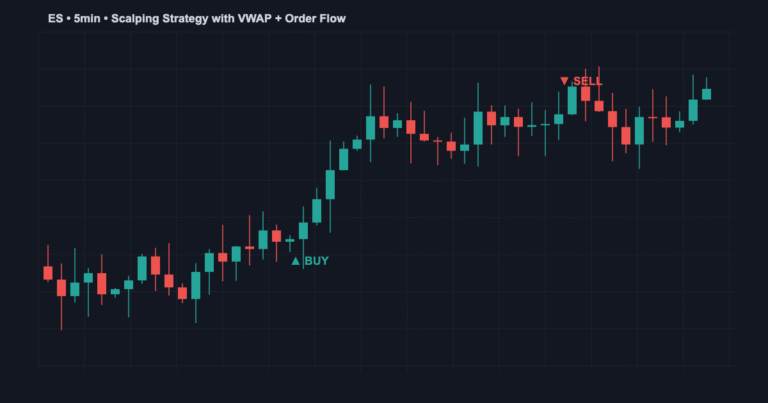
Volume-Based Indicators: Volume profile, VWAP on closed data, and On-Balance Volume (OBV).
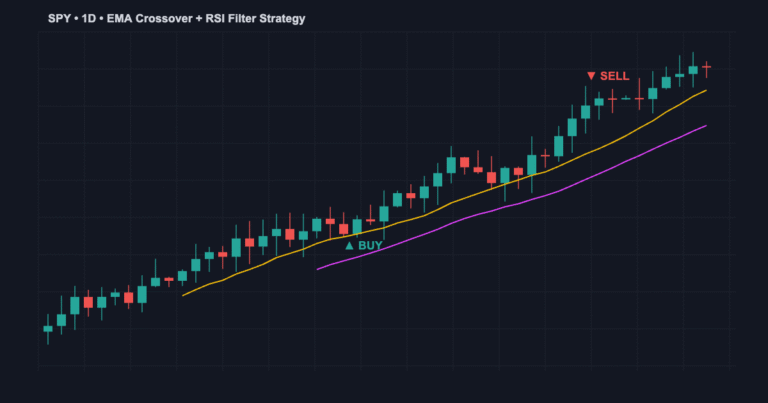
Moving Averages: Simple moving averages calculated on closed data are reliable but lag slightly.
Momentum Indicators: RSI, MACD, and Stochastic don’t repaint when calculated correctly on closed data.
Building Non-Repainting Indicators in Pine Script
Rule 1: Only Use Closed Bar Data
// WRONG - uses current bar
if close > open
    signal = true
// RIGHT - uses previous closed bar
if close[1] > open[1]
    signal = true
Rule 2: Use barstate.isconfirmed
if buySignal and barstate.isconfirmed
    alert("BUY SIGNAL", alert.freq_once_per_bar_close)
Rule 3: Use alert.freq_once_per_bar_close for alerts
This ensures alerts fire exactly once when the bar closes, never during real-time tick changes.
Common Mistakes That Cause Repainting
- Using close without [1] offset in calculations
- Using request.security() on current bar data
- Mixing alerts with real-time data instead of confirmed bars
- Plotting signals that recalculate on every tick
Frequently Asked Questions
Q: Do all strategies repaint if not coded carefully?
A: Yes. Even simple strategies repaint if they use current bar data without confirming.
Q: Can I fix a repainting indicator?
A: Sometimes. Modify it to use previous bars with [1] offset, though this adds lag.
Q: What’s the best non-repainting indicator for day trading?
A: Price action + volume + moving averages are most reliable on 5-15 minute charts.
Q: Do TradingView’s default indicators repaint?
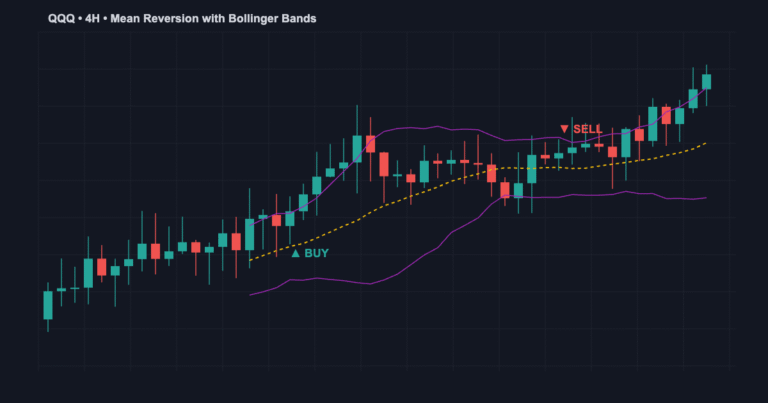
A: Built-in indicators (RSI, MACD, Bollinger Bands) don’t repaint on closed bars. Third-party indicators vary.
Conclusion
Non-repainting indicators are non-negotiable for serious traders. Always use closed bar data, barstate.isconfirmed, and alert.freq_once_per_bar_close. For strategy testing guidance, check our backtesting guide and algo trading overview.