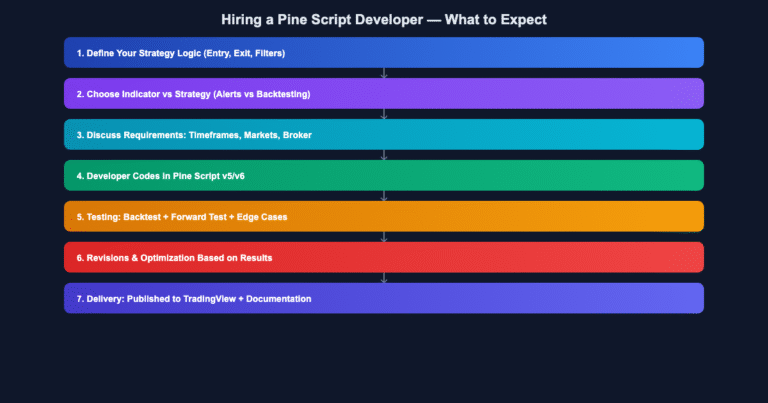
What is Multi-Timeframe Analysis?
Multi-timeframe (MTF) analysis allows traders to analyze multiple timeframes simultaneously within a single indicator or strategy. Using Pine Script’s request.security() function, you can fetch data from higher timeframes and make trading decisions based on confluence across multiple timeframes.
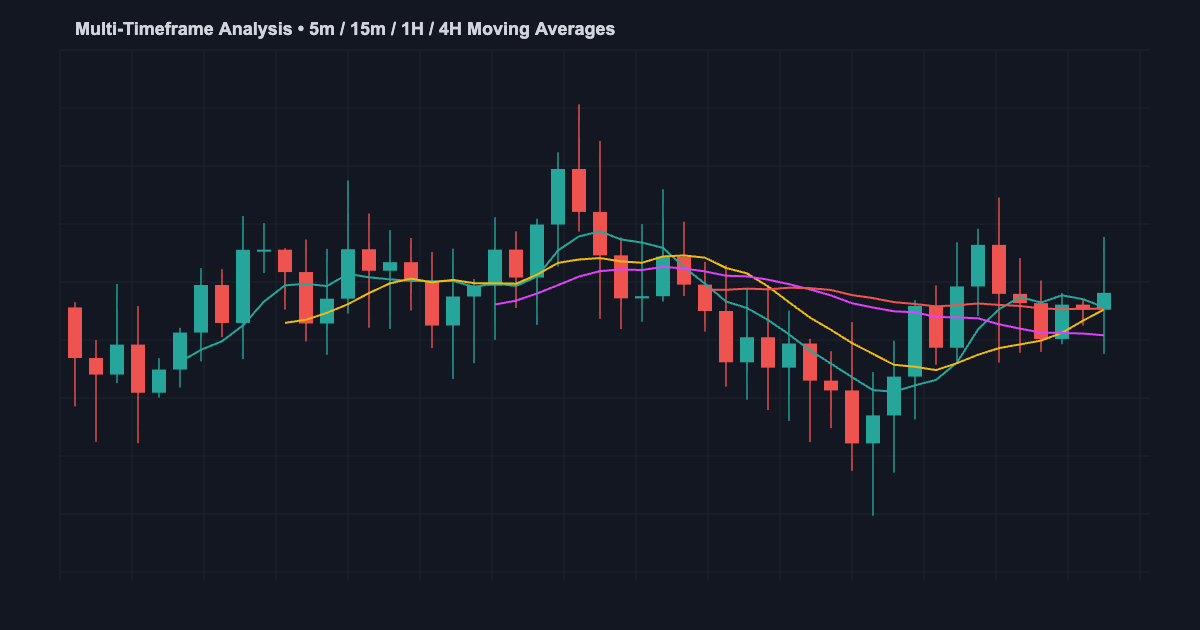
This approach is particularly powerful for Indian stocks on NSE, where confirming signals across 5-minute, 15-minute, hourly, and daily charts can significantly improve trade quality.
Visit jayadevrana.com for professional Pine Script solutions.
Understanding request.security() Function
The request.security() function is the foundation of MTF analysis in Pine Script v5. It allows you to fetch data from different timeframes and securities.
request.security(symbol, timeframe, expression)Parameters:
- symbol: The trading pair (e.g., “NSE:SBIN”)
- timeframe: The target timeframe (e.g., “5”, “15”, “60”, “D”)
- expression: The data or calculation to fetch (e.g., close, ta.rsi(close, 14))
MTF RSI Indicator Code Example
//@version=5
indicator("MTF RSI", overlay=false)

rsi14 = ta.rsi(close, 14)
rsi15m = request.security(syminfo.tickerid, "15", ta.rsi(close, 14))
rsi1h = request.security(syminfo.tickerid, "60", ta.rsi(close, 14))
rsi1d = request.security(syminfo.tickerid, "D", ta.rsi(close, 14))

plot(rsi14, color=color.blue, title="5m RSI")
plot(rsi15m, color=color.orange, title="15m RSI")
plot(rsi1h, color=color.purple, title="1h RSI")
plot(rsi1d, color=color.red, title="1D RSI")
hline(50, linestyle=hline.style_dashed)
MTF Moving Average Ribbon Code
//@version=5
indicator("MTF MA Ribbon", overlay=true)

ma5 = ta.sma(close, 20)
ma15 = request.security(syminfo.tickerid, "15", ta.sma(close, 20))
ma1h = request.security(syminfo.tickerid, "60", ta.sma(close, 20))
ma1d = request.security(syminfo.tickerid, "D", ta.sma(close, 20))

plot(ma5, color=color.blue, linewidth=1)
plot(ma15, color=color.orange, linewidth=1)
plot(ma1h, color=color.purple, linewidth=1)
plot(ma1d, color=color.red, linewidth=2)
The Repainting Problem and Solution
Repainting occurs when request.security() uses incomplete candle data. The fix is simple: use close[1] (previous closed bar) instead of close (current bar).
// Repainting (avoid this)
rsi_bad = request.security(syminfo.tickerid, "60", ta.rsi(close, 14))

// Non-repainting (correct)
rsi_good = request.security(syminfo.tickerid, "60", ta.rsi(close[1], 14))
Common MTF Analysis Mistakes
- Not accounting for timeframe completion: Always wait for the timeframe to close before acting
- Repainting indicators: Use previous closed data, not current bar
- Over-filtering signals: Too many conditions can eliminate all trade opportunities
- Ignoring volatility: Higher timeframes have different stop-loss requirements
- Not backtesting: Validate your MTF logic on historical data first
Practical Examples for Indian Stocks
Testing SBIN (State Bank of India) on NSE with MTF analysis:
A confluence signal occurs when:
- 5-minute RSI > 60 (bullish)
- 15-minute RSI > 50 (trending up)
- 1-hour close > 1-hour 20 SMA
- Daily close > Daily 50 SMA
FAQ
Q: Can I use MTF analysis with any indicator?
A: Yes, request.security() works with any calculation. Be cautious with repainting indicators.
Q: What’s the best timeframe combination?
A: For intraday: 5m, 15m, 1h. For swing: 1h, 4h, 1D. For positional: 1D, 1W.
Q: How do I prevent false signals?
A: Add volume confirmation and ATR-based stop losses.
Chat on WhatsApp for custom MTF strategies
Need a Custom Pine Script Solution?
Jayadev Rana is a professional Pine Script developer who builds custom indicators, strategies, and automated trading systems for TradingView.