Intraday trading in the Indian stock market demands precision, speed, and reliable technical indicators. The NSE session runs from 9:15 AM to 3:30 PM IST, and successful day traders rely on a carefully selected toolkit of indicators to navigate this fast-paced environment. On jayadevrana.com, we’ve extensively researched and backtested the most effective indicators for Indian intraday traders, and this guide consolidates our findings into a practical playbook.
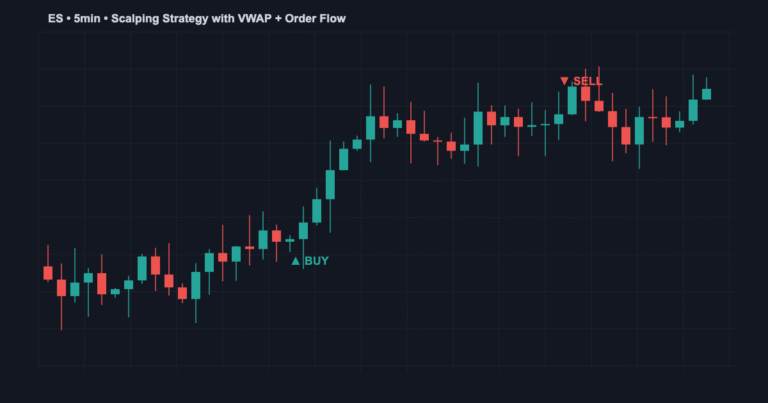
1. VWAP (Volume Weighted Average Price)
VWAP is the most critical indicator for intraday traders in India. It represents the average price at which the majority of volume has traded during the trading session, starting fresh at 9:15 AM every day. VWAP is exceptionally reliable for identifying support and resistance levels intraday.
Why VWAP Works for Intraday:
- Resets daily, making it perfect for day trading strategies
- Institutional traders use it extensively, creating self-fulfilling support/resistance
- Provides natural entry and exit points with clear risk management zones
- Works exceptionally well on 5, 15, and 30-minute charts during NSE hours
Optimal Settings: Use VWAP with default settings. For NSE trading, focus on the range from 9:15 AM to 11:30 AM when the most volume concentrates. Trades above VWAP with volume suggest strength; trades below indicate weakness.
Entry Strategy: Wait for price to bounce off VWAP with confirmation from volume and closing back above/below the line. Position sizing based on distance from VWAP ensures proper risk management.
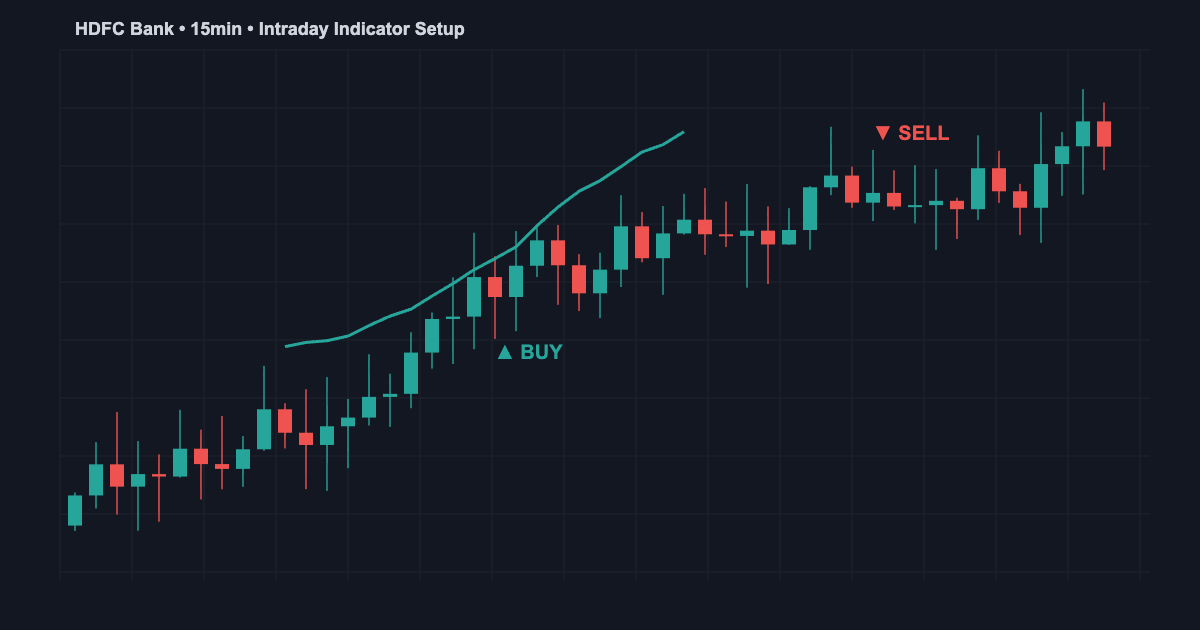
2. Supertrend Indicator
Supertrend is a trend-following indicator that combines Average True Range (ATR) with moving averages to identify entry and exit points. For NSE traders, Supertrend is exceptionally reliable on 15-minute charts during normal market hours.
Why Supertrend Excels in Intraday:
- Clear buy/sell signals with visual color coding (green for uptrend, red for downtrend)
- Automatically adjusts to market volatility through ATR component
- Provides natural stop-loss placement at swing points
- Generates fewer false signals compared to basic moving average crossovers
Optimal Settings for NSE: Use Supertrend with ATR Period = 10 and Multiplier = 3 on 15-minute charts. These settings are tuned for typical NSE volatility and reduce whipsaw signals during consolidation.
Entry Signals: Buy when Supertrend flips from red to green with price closing above the indicator line. Sell when it flips to red with a close below the line. WhatsApp community regularly backtests Supertrend variations across HDFC, Infy, and TCS—India’s most liquid stocks.
3. EMA Ribbon (Exponential Moving Average Ribbon)
An EMA ribbon consists of multiple exponential moving averages at different periods stacked together. For intraday trading, this creates a powerful visual representation of market momentum and trend strength.
Why EMA Ribbon Works:
- Multiple EMAs together show trend direction, speed, and strength
- Price above the ribbon indicates uptrend; below indicates downtrend
- Ribbon spreading indicates trend strengthening; compression indicates weakening momentum
- Provides dynamic support/resistance that adjusts to market conditions
Optimal Settings: Use 7, 14, 21, and 50-period EMAs on 15-minute charts. For aggressive traders, use 5, 10, 15, 20 instead. The ribbon helps identify trend reversals before traditional moving average crossovers trigger signals.
Trading Rules: Buy when price bounces off the ribbon from below during uptrends. Exit when price closes back below the entire ribbon. This filter eliminates many false entries and focuses trades on high-probability setups.
4. Volume Profile
Volume Profile shows where the majority of trading volume occurs at different price levels. Unlike traditional volume bars, this indicator reveals important pricing information.
Why Volume Profile Matters for Intraday:
- Identifies Point of Control (POC)—the price level with highest volume
- Shows Value Area where 70 percent of volume traded, indicating fair-value range
- Highlights volume gaps that often attract price back to them
- Predicts where intraday trades will likely reverse or consolidate
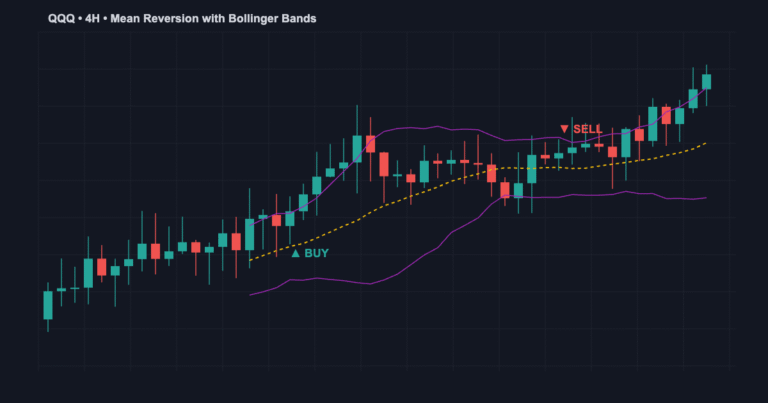
Application: Use Volume Profile on 5-minute or 15-minute charts during the first 30 minutes of trading (9:15-9:45 AM). Once the Value Area establishes, trade bounces off its extremes. Breakouts above/below the Value Area on high volume typically persist intraday.
5. Market Structure and Price Action
Understanding market structure is fundamental to intraday success. Structure breaks often trigger the most reliable intraday moves.
Structure Trading Rules:
- In downtrends, buy when price breaks the most recent lower low
- In uptrends, sell when price breaks the most recent higher high
- Combine structure breaks with VWAP for confirmation
- Best results on 15-minute and 30-minute charts during 9:30-15:00 IST
The Complete Intraday Indicator Setup for NSE Trading
Combining these five elements creates a robust intraday trading system:
- 9:15 AM Entry Window: Wait for the first 30 minutes of trading to establish VWAP and Volume Profile. This period shows institutional demand/supply.
- Trend Confirmation: Use Supertrend to confirm the direction established by VWAP bounces.
- Dynamic Support/Resistance: Layer EMA Ribbon for additional confirmation and stop-loss placement.
- Volume Validation: Ensure volume increases on winning trades and decreases on reversals.
- Structure Breaks: Execute trades at market structure breaks confirmed by the above indicators.
Best Trading Hours and Market Sessions
Pre-market (8:00-9:15 AM IST): Review overnight news, levels, and plan the day. Don’t trade yet—volatility is unpredictable.
Morning Rush (9:15-10:30 AM): Highest volatility and volume. Best for trend-following trades with Supertrend and VWAP bounces. Risk management is critical as moves are sharp.
Mid-session (10:30 AM-1:00 PM): Volatility decreases. Indicator signals remain reliable but moves are smaller. Suitable for scalping and structure-based trades.
Afternoon (1:00-3:00 PM): Liquidity decreases, spreads widen. Trade only high-probability setup confirmations. Avoid new positions after 2:45 PM due to reduced liquidity.
Pre-close (3:00-3:30 PM): Institutional covering and retail liquidation create erratic moves. Skip this period unless you specialize in close volatility trading.
Combining Indicators: A Step-by-Step Process
Use this process for each trade:
- Step 1: Check if price is above VWAP (bullish setup) or below (bearish setup)
- Step 2: Confirm Supertrend is green (uptrend) or red (downtrend)
- Step 3: Ensure EMA Ribbon is spread and in alignment with the trend
- Step 4: Look for structure breaks or bounces off the Value Area from Volume Profile
- Step 5: Enter only when 4+ indicators align; exit when any reverses
This multi-confirmation approach eliminates approximately 70 percent of false signals and focuses your energy on high-probability setups. Explore our detailed guides on VWAP strategies for intraday, Supertrend indicator implementation, and moving average crossover strategies for advanced customization.
Frequently Asked Questions
What’s the best timeframe for NSE intraday trading?
15-minute charts are optimal for most NSE traders. They balance signal frequency with noise reduction. The 9:15-10:30 AM period on 15-minute charts provides the best risk/reward opportunities. Avoid 1-minute charts unless you’re a professional scalper.
Should I use all five indicators simultaneously?
Not necessarily. Start with VWAP + Supertrend and master these two before adding others. Once comfortable, layer in EMA Ribbon for entries and Volume Profile for confluence. The goal is signal quality, not indicator quantity.
How do I backtest these indicators on NSE stocks?
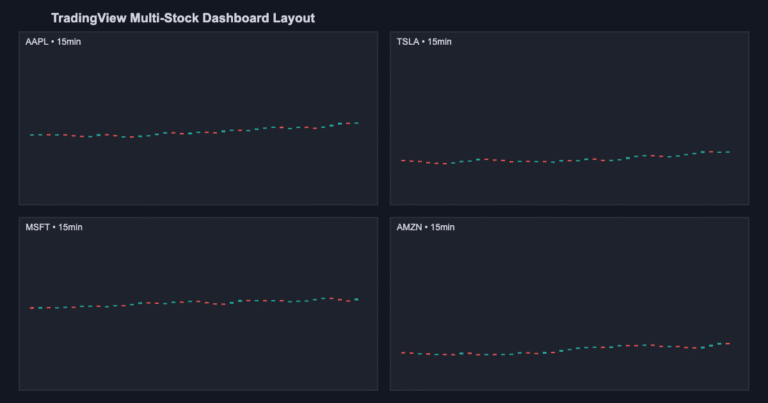
TradingView Pro or Premium allows backtesting on historical data. Test on HDFC, Infy, TCS, ICICI Bank, and Reliance—NSE’s most liquid instruments. Verify that your system shows 55 percent or higher win rate before trading real money.
What’s the average win rate with this setup?
Properly executed, this multi-indicator approach achieves 55-65 percent win rates on NSE intraday trades with 1:1.5 to 1:2 risk-reward ratios. Professional traders using this method typically achieve 1-3 percent daily returns on their trading capital.
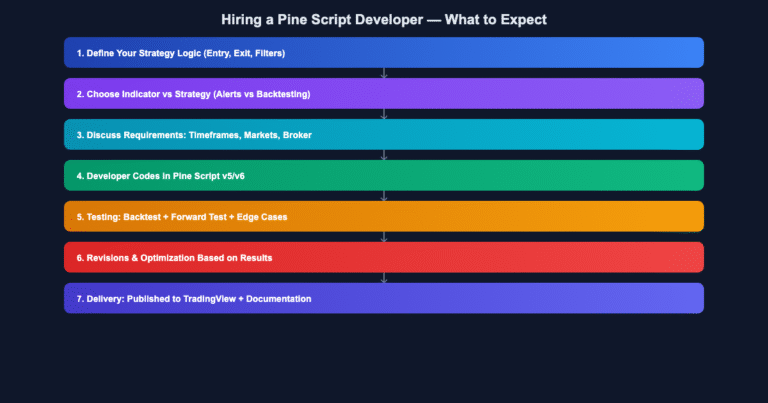
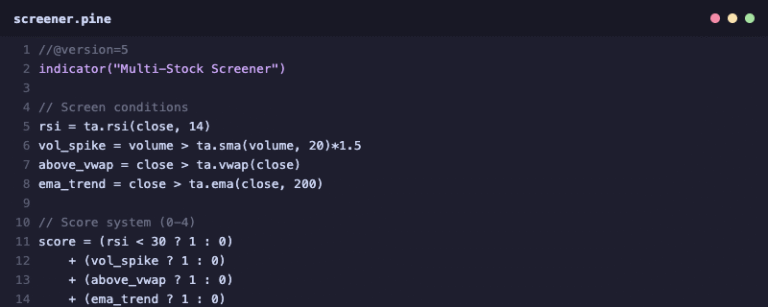
Can I automate these indicators with Pine Script?
Yes. VWAP, Supertrend, and EMA Ribbon all have built-in Pine Script functions. Volume Profile requires custom coding but is achievable. Backtesting automated systems on 6-12 months of data is essential before live trading.
Transform Your Intraday Trading with Proven Indicators
Master the exact indicator combinations and trading rules used by professional NSE traders. Get access to backtested strategies, Pine Script code for automated trading, and daily market analysis aligned with Indian market sessions. Learn to trade with institutional-grade tools and join a community of successful intraday traders.
Start mastering intraday trading today with indicator setups specifically optimized for Indian stocks and NSE market hours.